UPDATE 2022.01.26
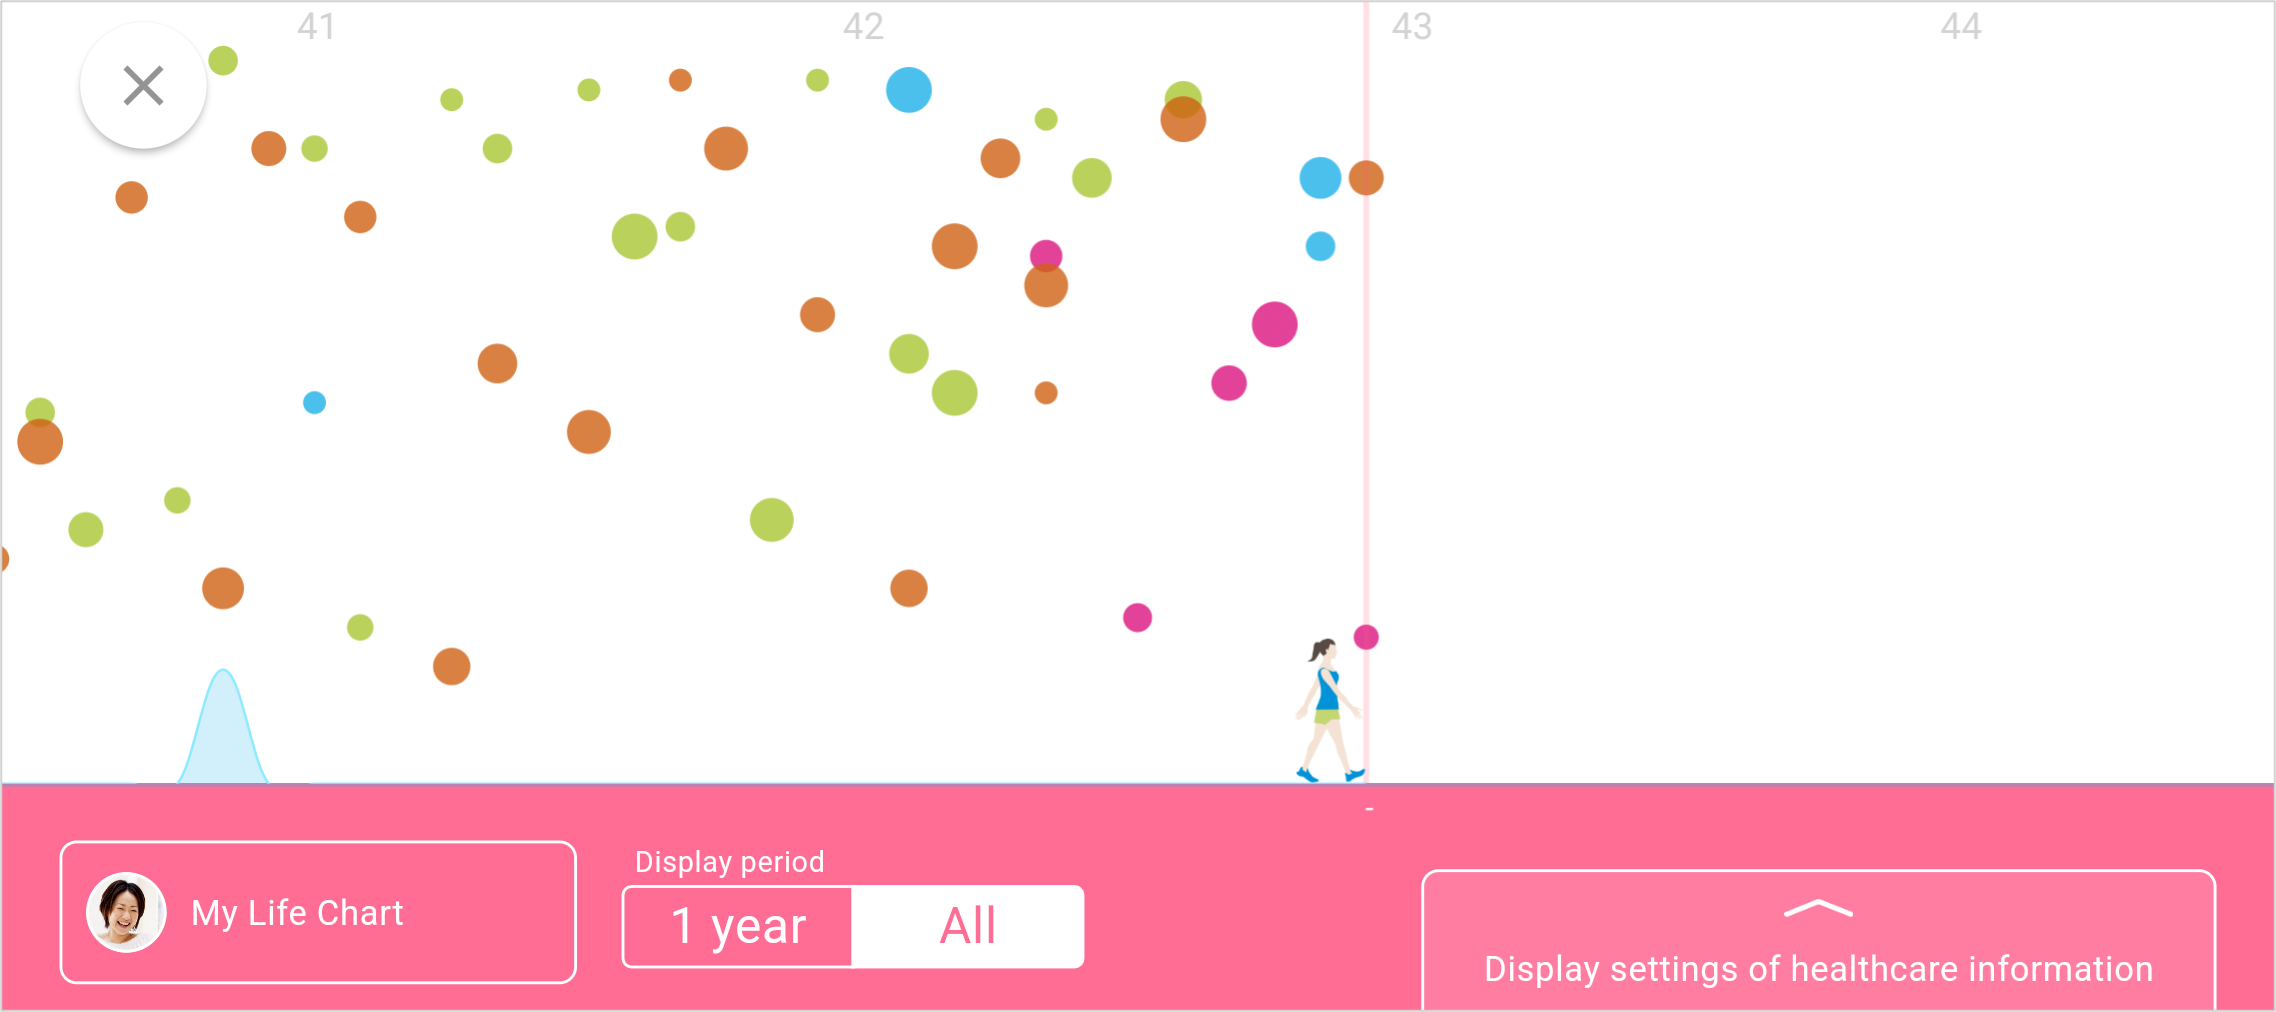
The graph displayed in Life Chart
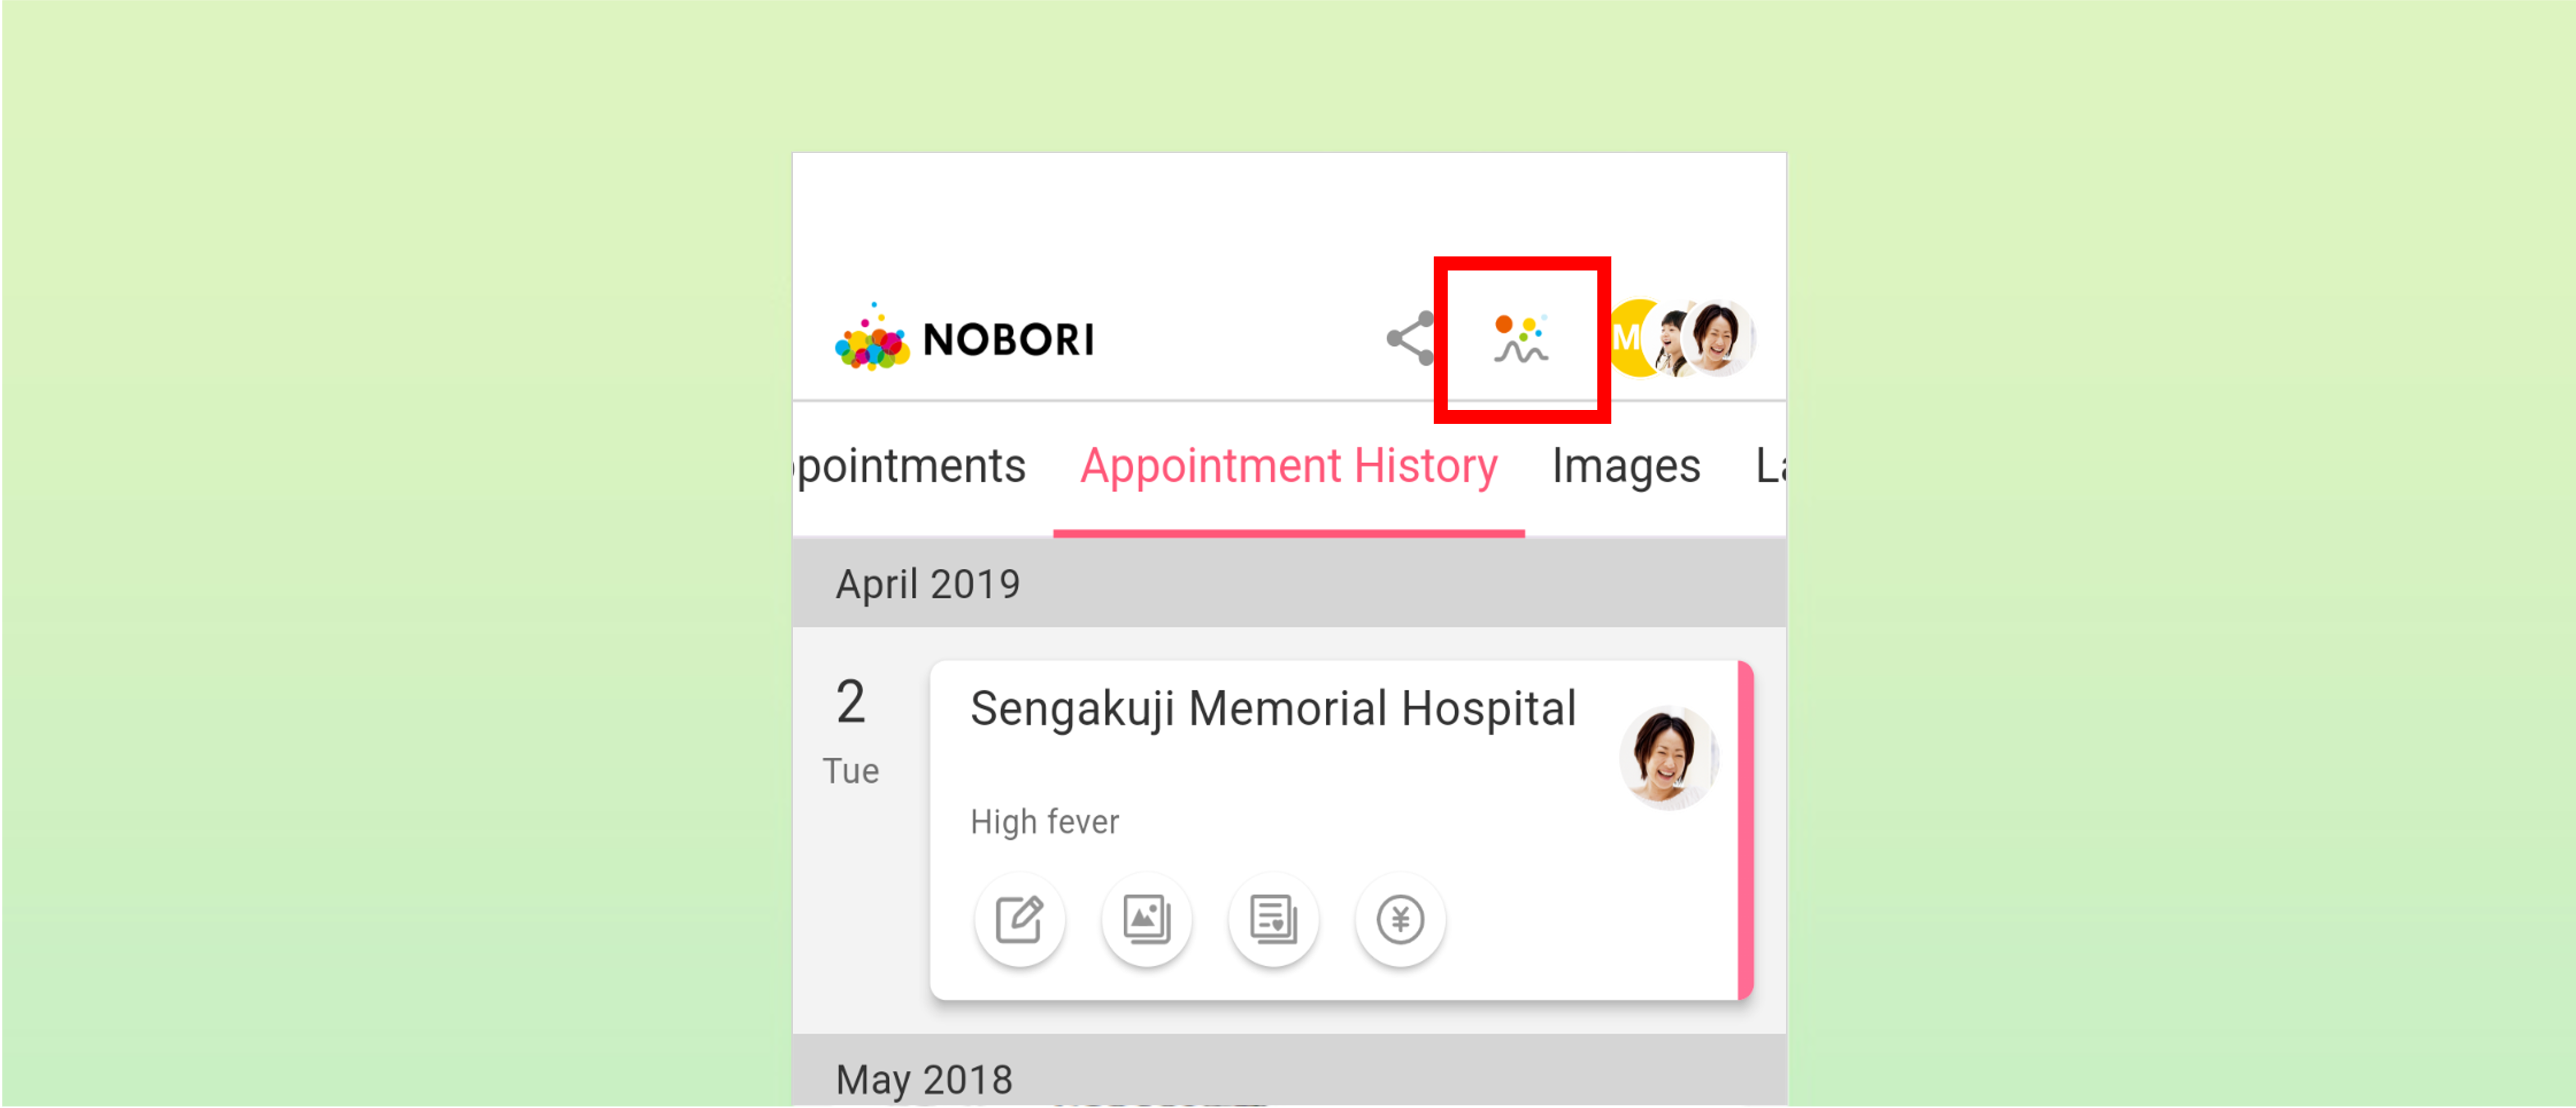
Follow the instruction below to view the Life Chart graph.
Open Life Chart.
The vertical axis is not related to bubble size. The horizontal axis represents the time axis of the following scales:
1 year: 1 unit means 1 day
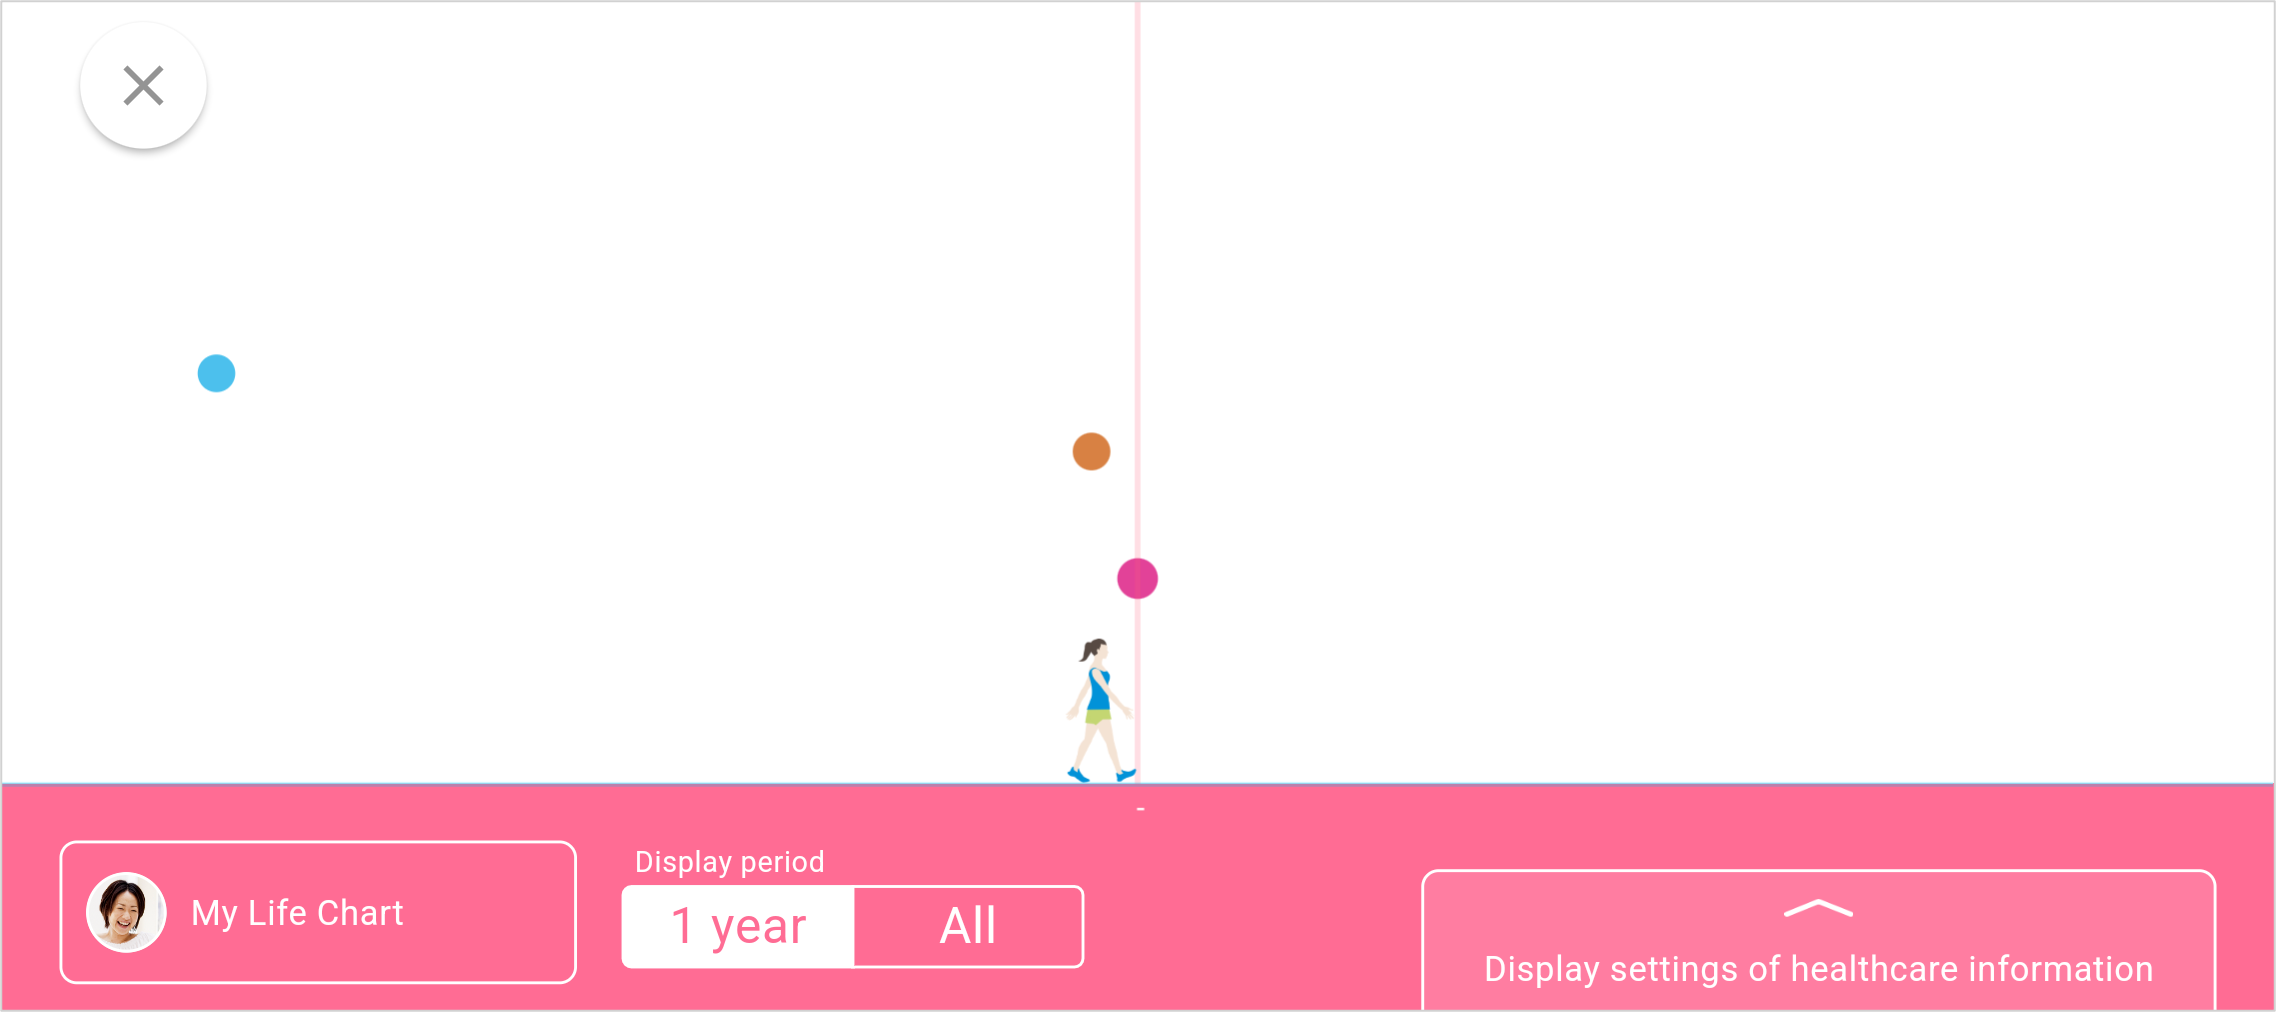
All: 1 unit means 1 month
